This article is older than 2 years. Some information might be outdated.
Hello! We will discuss the use of a simple and effective function I discovered to get the sum of specific columns in a table on MySQL (phpMyAdmin). In addition, we will visualize this data using morris.js, one of my favorite chart libraries. 🎨📊
Data Collection#
The following code will get the sum of hesap_toplam and hesap_odenen columns and create a chart.
Sample Visualization#
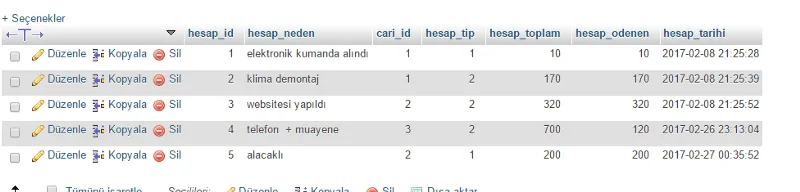
Code#
Morris.Donut({
    element: 'morris-donut-chart',
    data: [
        <?php
        $kac_tane = $db->query("SELECT SUM(hesap_toplam) AS toplagel FROM hesaplar")->fetch();
        $kac_bane = $db->query("SELECT SUM(hesap_odenen) AS bulgel FROM hesaplar")->fetch();

        $toplam = $kac_tane['toplagel'];
        $cik    = $kac_bane['bulgel'];

        echo '{label: "Total Debts", value: '.$toplam.'},';
        echo '{label: "Total Payments", value: '.$cik.'}';
        ?>
    ]
});
Explanations#
- SUM() function sums all values in a specific column.
- fetch() method gets the result of the query and assigns it to variables.
- Morris.js Donut chart is used to visualize the acquired data as a graph.
Result#
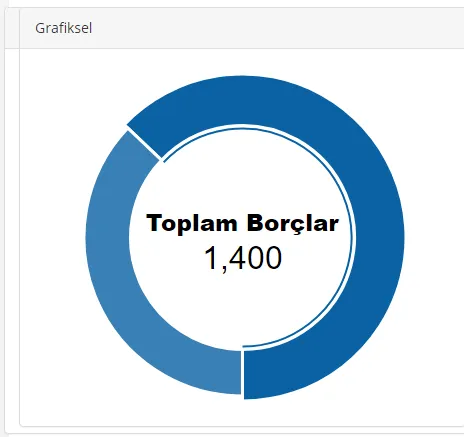
After running the code, you will get a chart like the following:
If you have any questions, you can leave a comment! 💬😊
Comments